Success = talent + luck
Big success = a little more talent + a lot of luck
In his book Think Fast, Think Slowly, psychologist and Nobel laureate in economics Daniel Kahneman poses this equation with a high-level golf tournament in mind.
Assuming that a golfer obtains a very good score above the average (although in golf the fewer strokes the better, here we will take a superior performance above the average), following the formula, it could be said that the player is talented and has had good luck that day.
Analyzing the possibilities between that golfer and another who has not done so well, two possibilities could arise for the next day of competition:
1- the one who did it well the first day is likely to do it well again, but a little less than the first time, since he was lucky on the first day, and it is unlikely that it will be repeated.
2-the one who did not do so well the first day, is probably still below average, but will improve as his bad luck may not continue.
This statistical pattern is called regression toward the mean, it is the phenomenon in which if a variable is extreme in its first measurement, it will tend to be closer to the mean in its second measurement and, paradoxically, if it is extreme in its second measurement, it will tend to have been closer to the mean on its first. The first to notice it was Francis Galton in the nineteenth century when he observed a simple linear regression in his article: ¨Regression towards mediocrity in hereditary stature¨ comparing the stature of the parents with the offspring.
Taking this idea, I began to see this pattern in the finalists of the four 2021 Boulder World Cups. I analyze the result obtained in the semifinal compared to that obtained in the final. Draw the data pairs on a graph and obtain their coefficient of determination (R²). The results are in the following graphs, where the R² for men turned out to be 0.86 and for women it is 0.55.
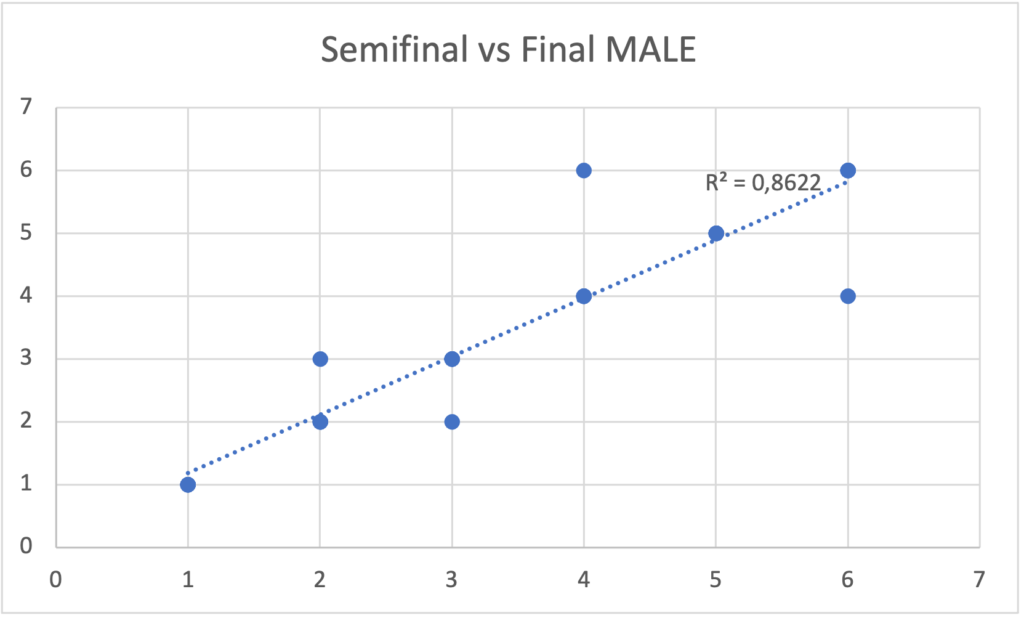
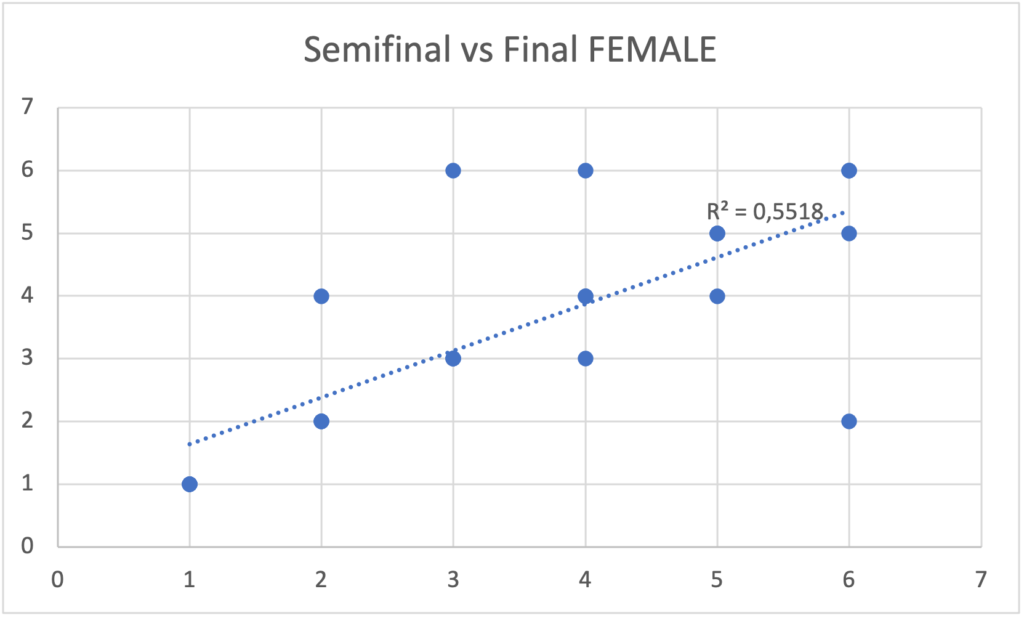
An R² of 0 indicates that the model does not explain any portion of the variability of the response data around its mean, while an R² of 1 indicates that the model explains all the variability of the response data around its mean. In other words, the men’s model of the positions obtained in the semifinal explains by 86% the variance of the result in the final, that is, those who obtained a good place in the semifinal, are more likely to obtain a similar place in the final. In the case of women, this explanation of the variance is reduced to 55%.
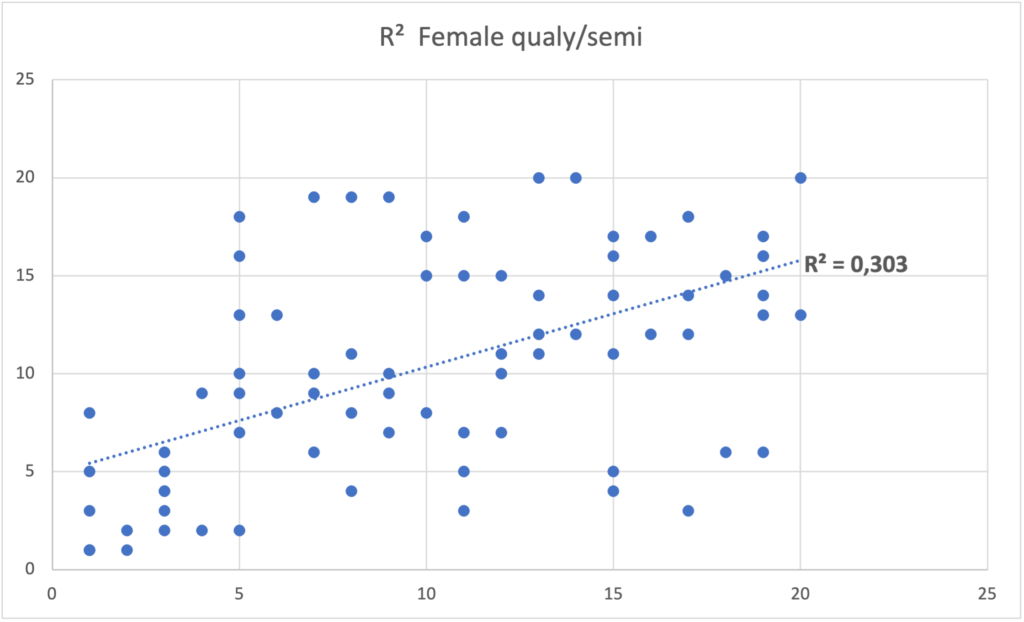
But when we extend this analysis to the results of the qualy in relation to those of the semi-final, the data are quite different, in the case of men, the R² is 0.032 and the R² of women is 0.30. The difference in levels is definitely very noticeable and there is great variability in the results, with almost zero correlation for men.
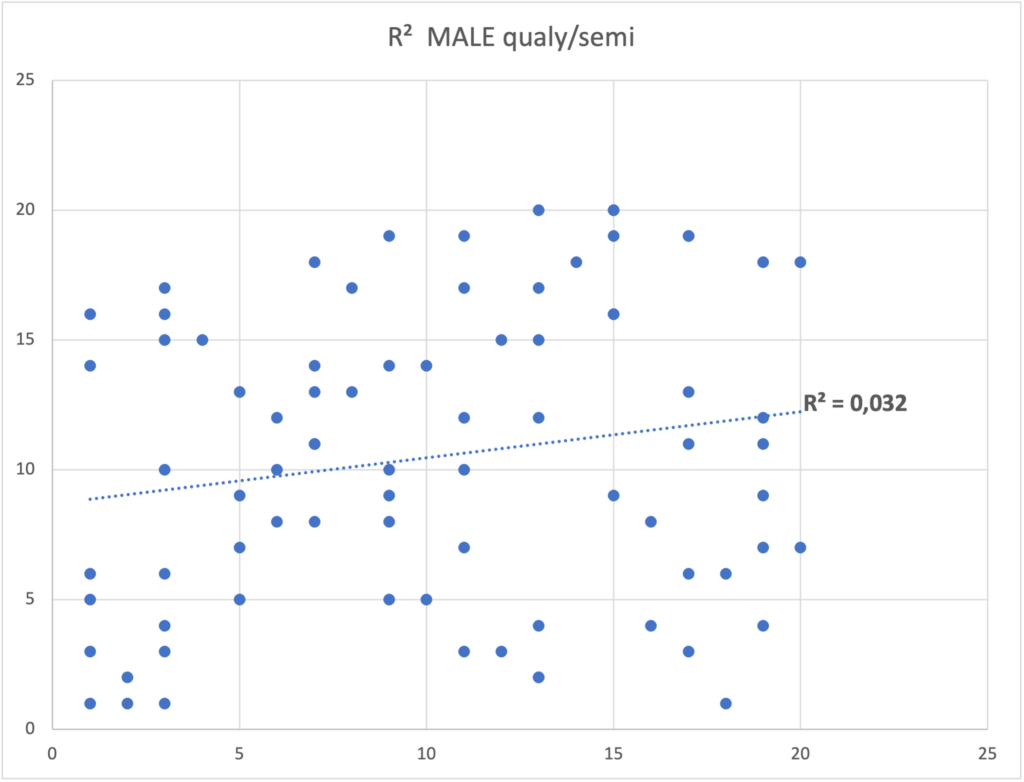
We must be especially careful with regression towards the mean when trying to establish causality between two factors. When the correlation is imperfect as in the case of qualy relative to the semi-final, the best will always seem to get worse and the worst will always seem to get better over time. Regardless of any intervention, those who obtained a bad position in the qualy would obtain a better position in the semifinal.
This type of reasoning is part of what is called the fallacy of regression towards the mean, which affirms or assumes that if one event occurs after another, the second is a consequence of the first. This is a very common error and is defined as the fact of not recognizing the influence of regression and our brain tends to look for a causal explanation to what is only a statistical regularity. The temporal sequence of two events is something inherent in causality: it is true that a cause occurs before an effect. The fallacy comes from drawing a conclusion based only on the order of events, which is not a reliable indicator. That is, it is not always true that the first event produced the second event.
To exemplify this fallacy, Kahneman mentions the well-known curse of “Sports Illustrated”, one of the best-known magazines in the world of sports. This curse predicts a poor performance in the following season for the athletes who have appeared on the cover of the magazine. To justify this, explanations such as excess pressure or confidence are sought, but the truth is that to appear on the cover the athlete must have had an exceptional performance, and it is to be expected that the performance of the following season will not be so.
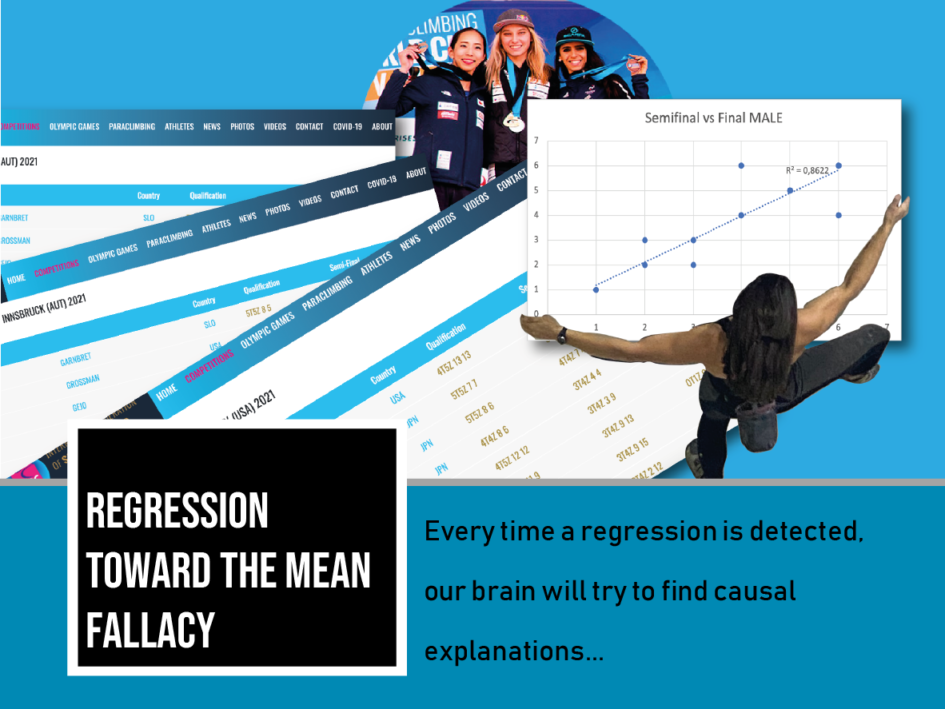
Every time a regression is detected, our brain will try to find causal explanations, but the truth is that regression towards the mean has an EXPLANATION, but not a CAUSE.
Although there are some examples that seem to contradict the phenomenon of regression to the mean: Janja Garnbret and the Argentine economy, even though they have a historical record, in the following measurement they stand out again.

References:
Kahneman D. (2012). Pensar rápido, pensar despacio. Buenos Aires, Ed Debate, 2021.
Leave a Reply